
Analytics Overview in Ad Management
Analytics within the Ad Management Platform are powered by Looker. For more information about what you can do in that tool, please check out the Looker Knowledge Base.
Home Dashboard
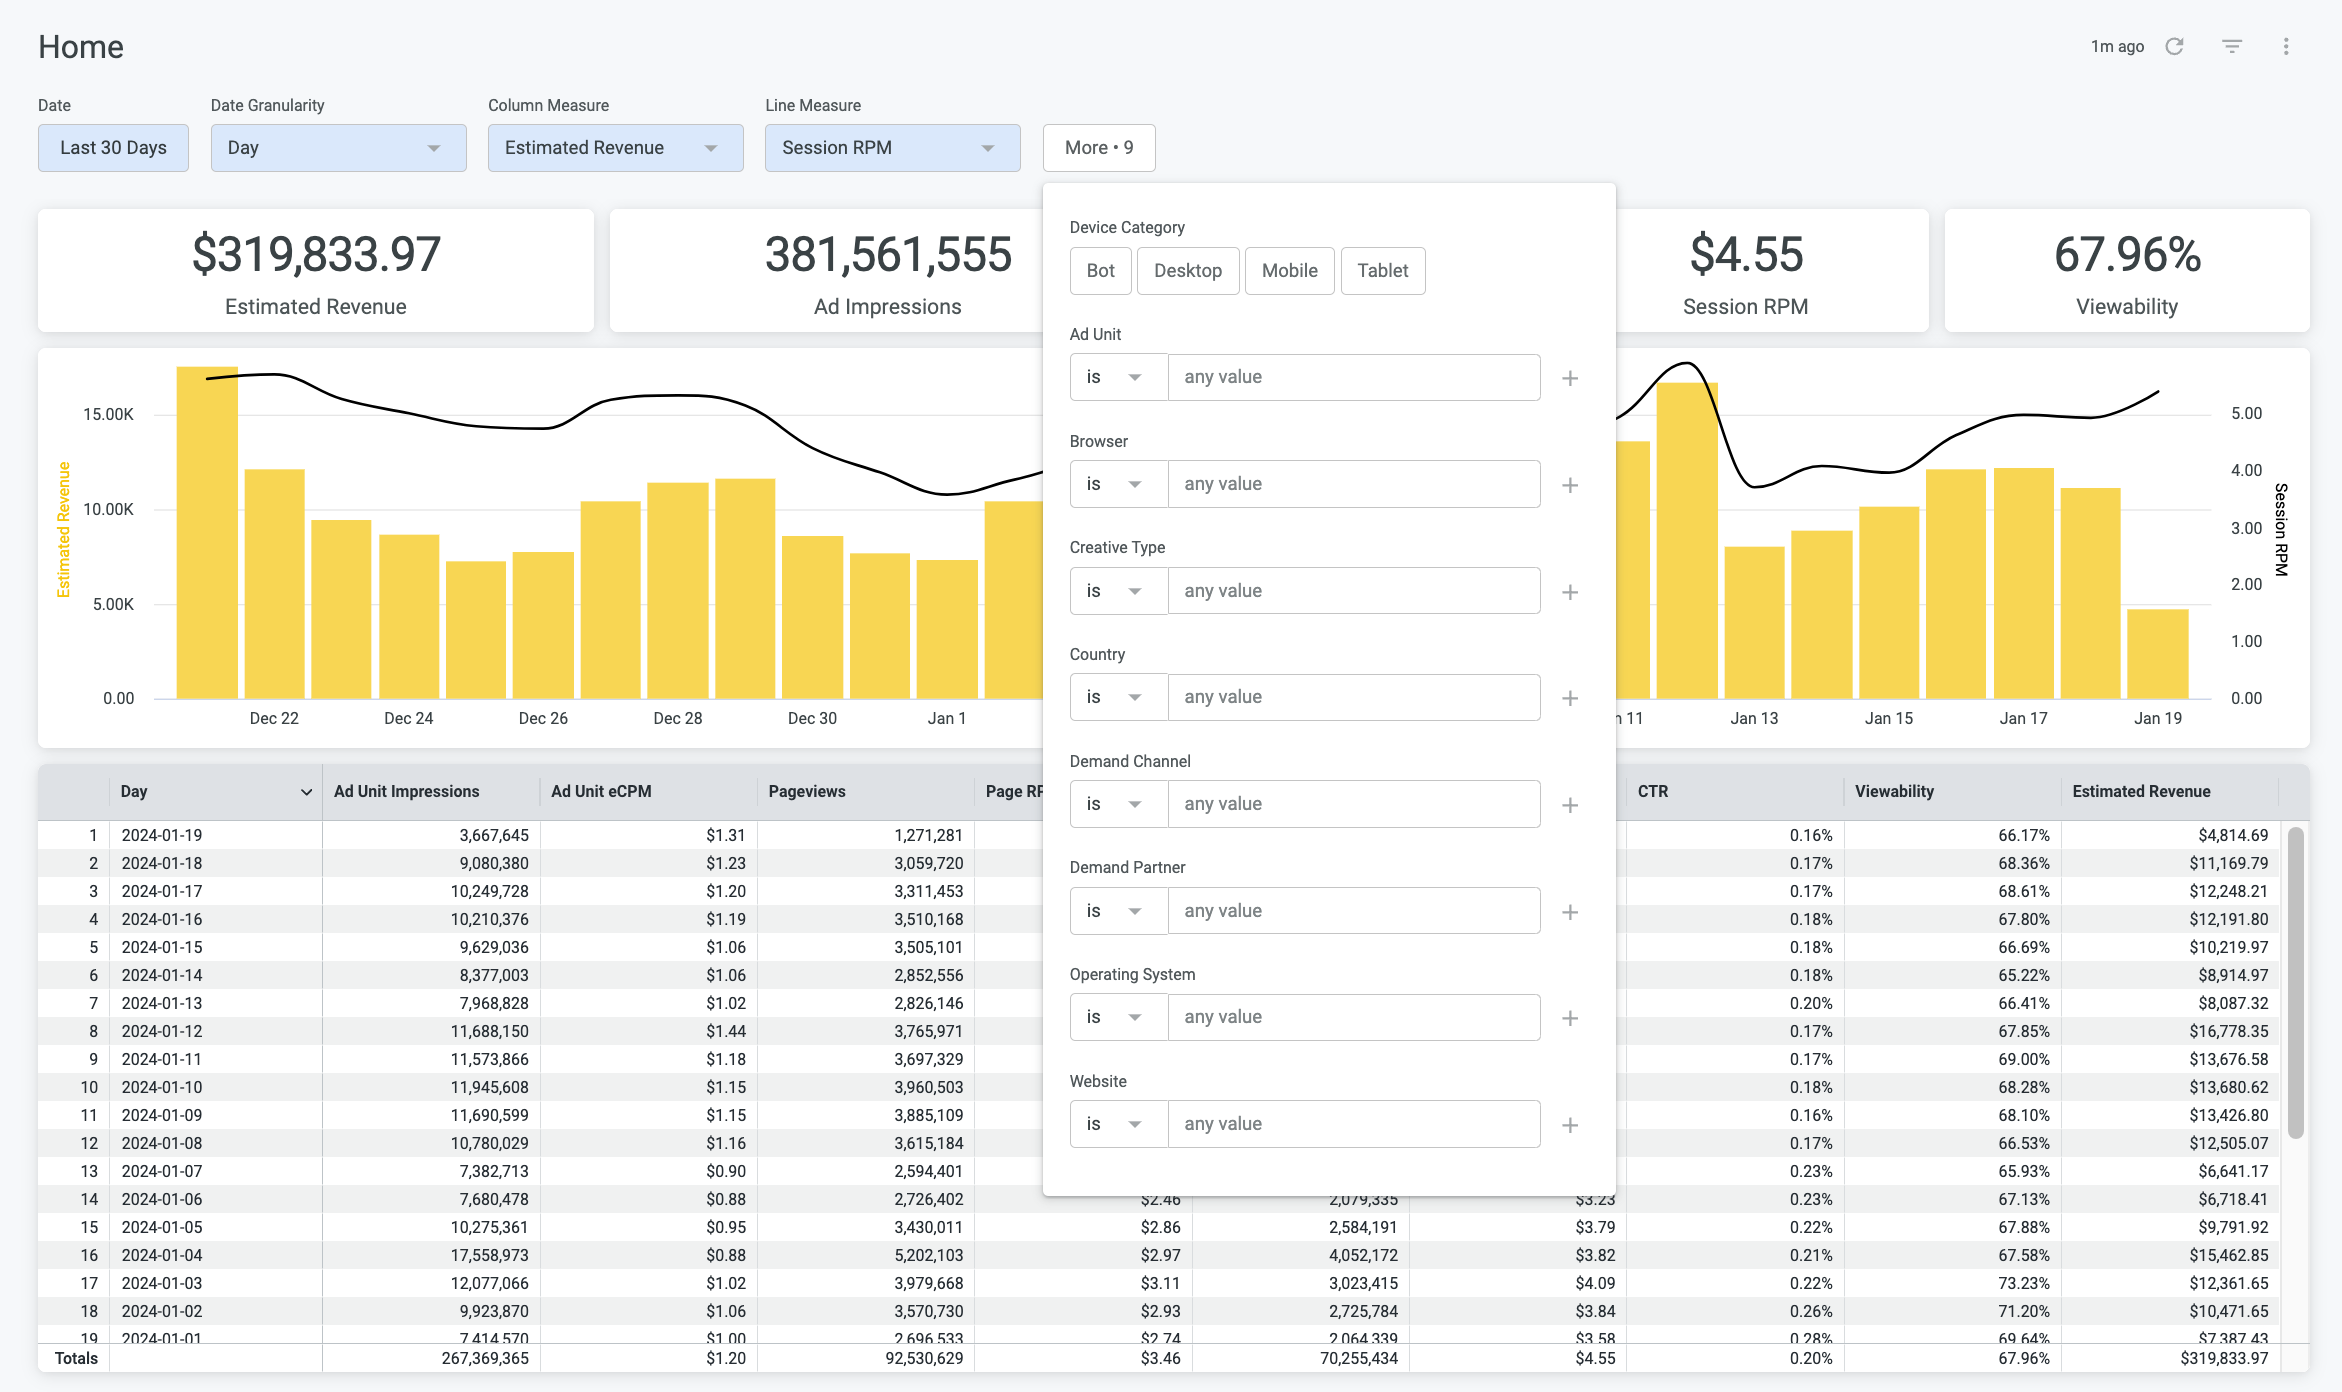
This is your Earnings Overview for all domains under your account.
To apply additional filters use the “More” Function, to split by Website, Ad Unit, Browser, Demand Options, and Operating System.
Analytics - Pre-Built Dashboards
Acquisition
UTM Campaign - Performance data broken out by the query string parameter ?utm_campaign.
Ex: facebook-ads, back-to-school-promo, email-newsletter
UTM Content - Performance data broken out by the query string parameter ?utm_content.
Ex: navigation-menu, subscribe-button
UTM Medium - Performance data broken out by the query string parameter ?utm_medium.
Ex: cpc, social, referral, display
UTM Source - Performance data broken out by the query string parameter ?utm_source.
Ex: facebook, google, bing, twitter, email, linkedin
UTM Term - Performance data broken out by the query string parameter ?utm_term.
Ex: news, politics, shopping, homepage, sports
Referrer - Performance data broken out by referrer URL, or the previous webpage the user visited before your site.
Ex: google.com, m.facebook.com, getpocket.com
Ad Unit
Performance by ad unit
Demand
Creative Type - Performance by creative type - Display or Outstream
Demand Partner - Performance by Demand Partner (e.g. Sovrn, Pubmatic, Magnite, etc)
Demand Channel - Performance by Demand Channel - Header Bidding, Open Bidding, Amazon Tam, OpenRTB, Ad Server.
Demand Deals - Performance by Demand Type (Open Market, Programmatic Deals, Direct)
Platform
Browser - Performance by Browser - e.g. Chrome, Safari Firefox, etc.
Country - Performance by Country
Device Category - Performance by Device Category - Desktop, Mobile, Tablet, Bot
Operating System - Performance by Operating System - Android, Linux, iOS, Mac OS X, and more.
Website - Performance broken out by website property.
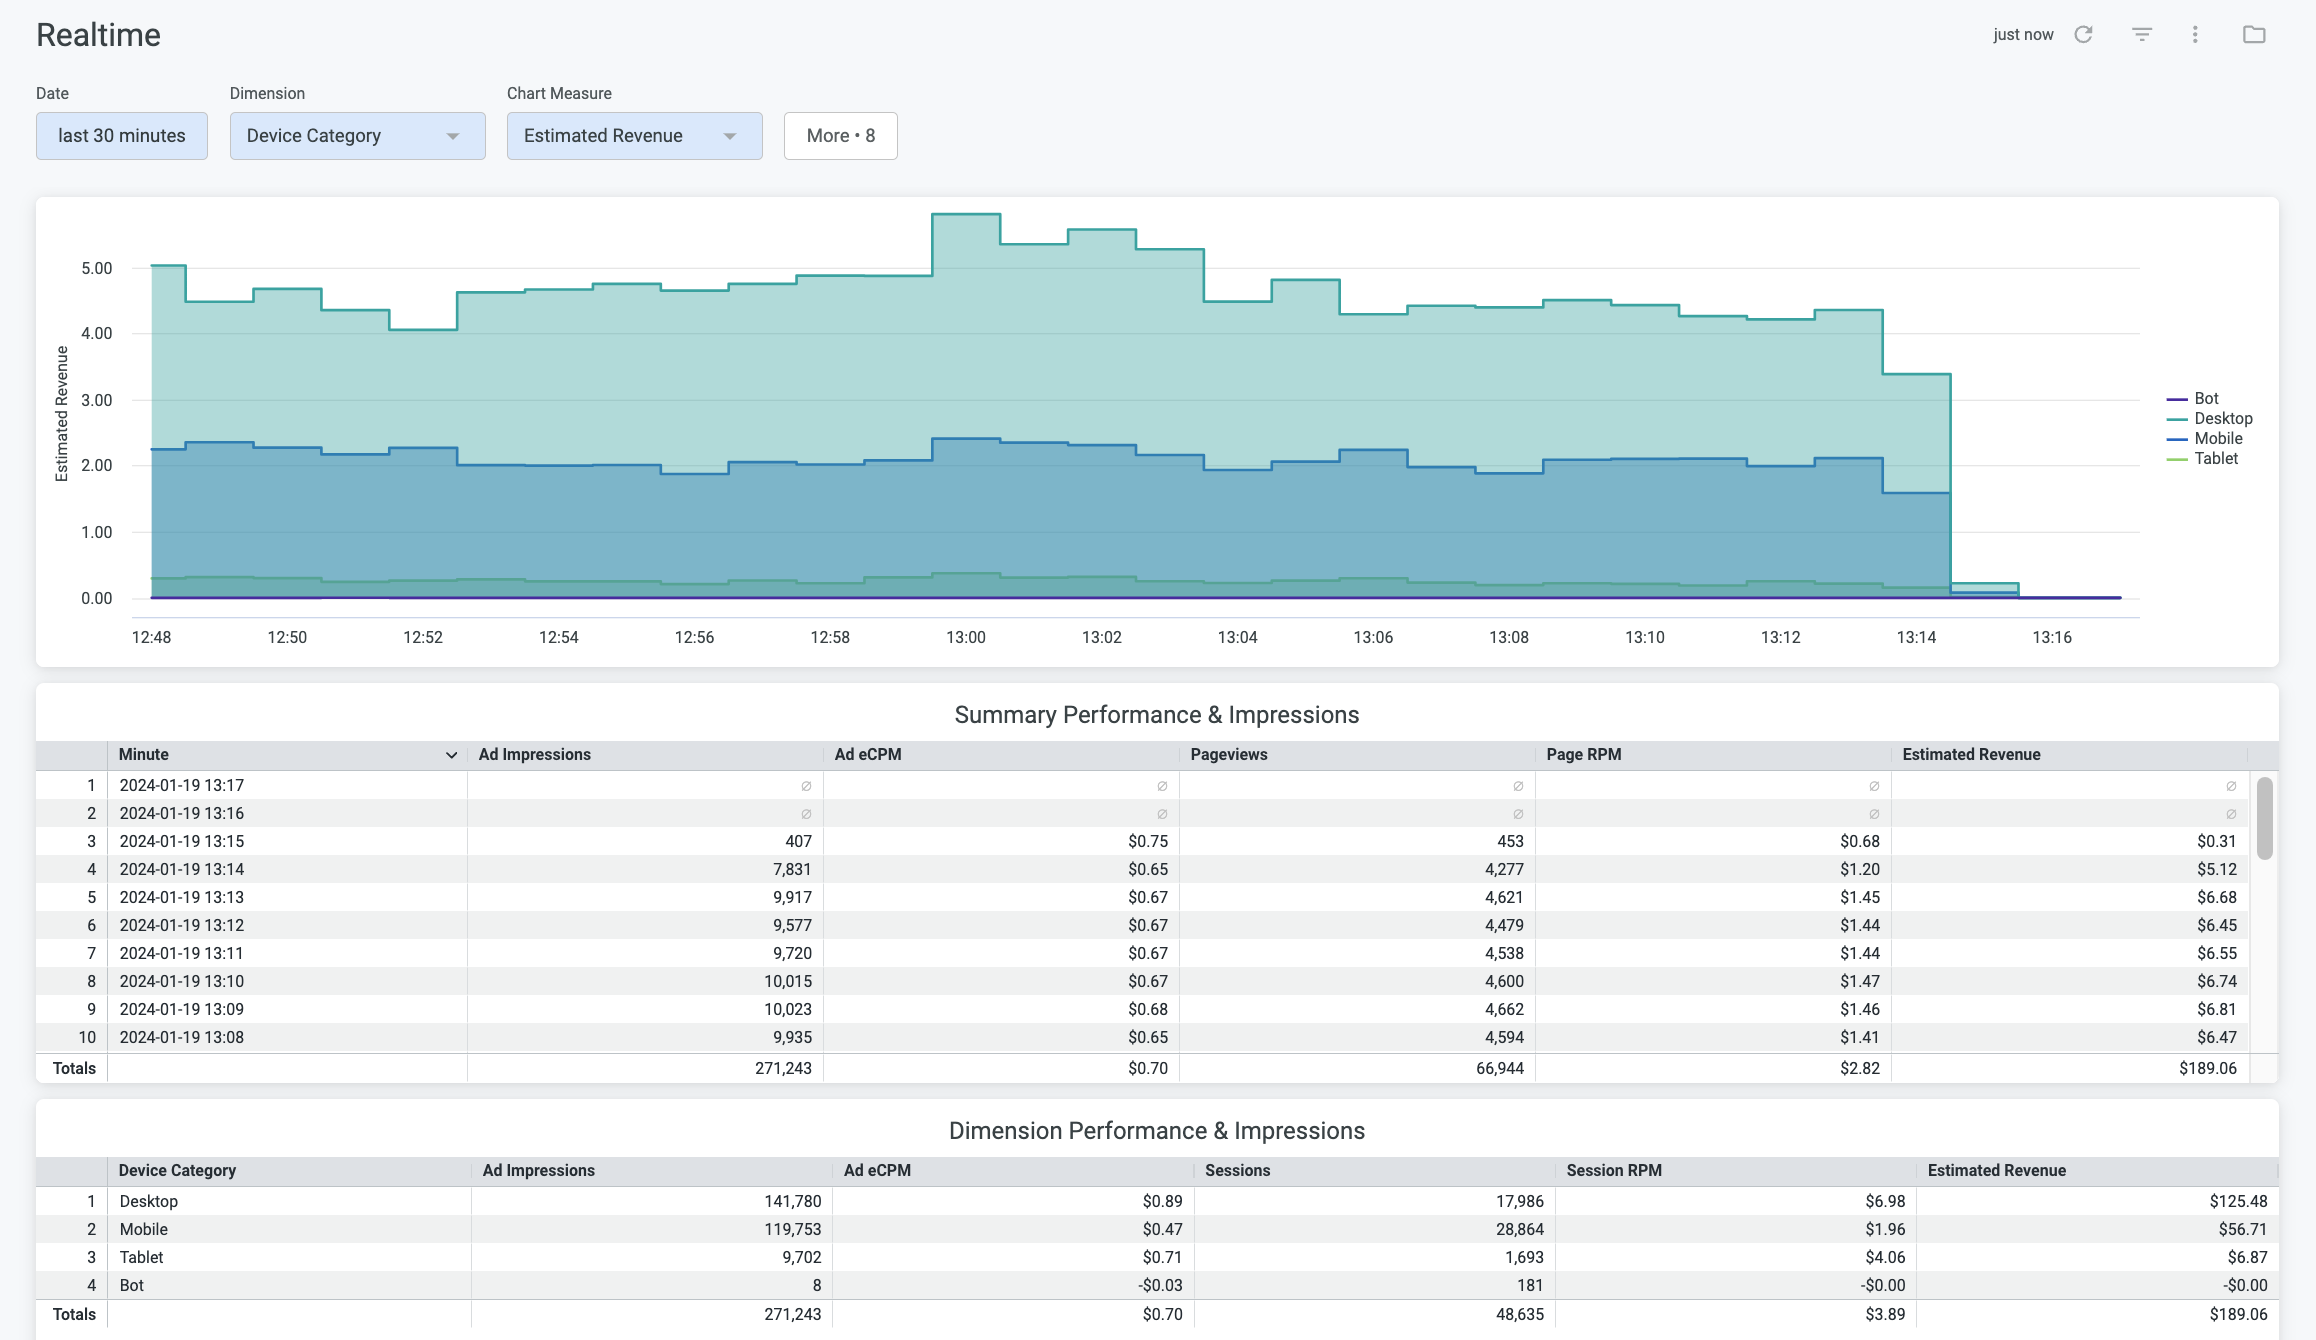
Real Time
The Real Time report displays revenue and impressions data by minute for up to the previous 2 hours. It is typically 2 minutes delayed from the time the actual impressions serve on the page. This is very useful for monitoring performance after changes have been made.
Analytics - Explore - Custom Reports
Custom Reports can be set up by using the “Explore” tab in the dashboard. To read more about how to use our Explore tool, visit Creating and Scheduling Custom Reports in the Ad Management Dashboard
Need more help?
Creating and Scheduling Custom Reports in the Ad Management Dashboard
Dimensions and Measures in Ad Management
If you still have questions, please reach out to admanagement@sovrn.com