
How are buyers are pricing my inventory?
By using Signal Segments to assign predicted viewability and engagement scores as key values to each impression, you can gain insights into how buyers are pricing your inventory.
You can access these insights by pulling the following report with your Google Ad Manager (GAM) account:
-
Within your GAM account, go to Reporting > Reports > New report.
-
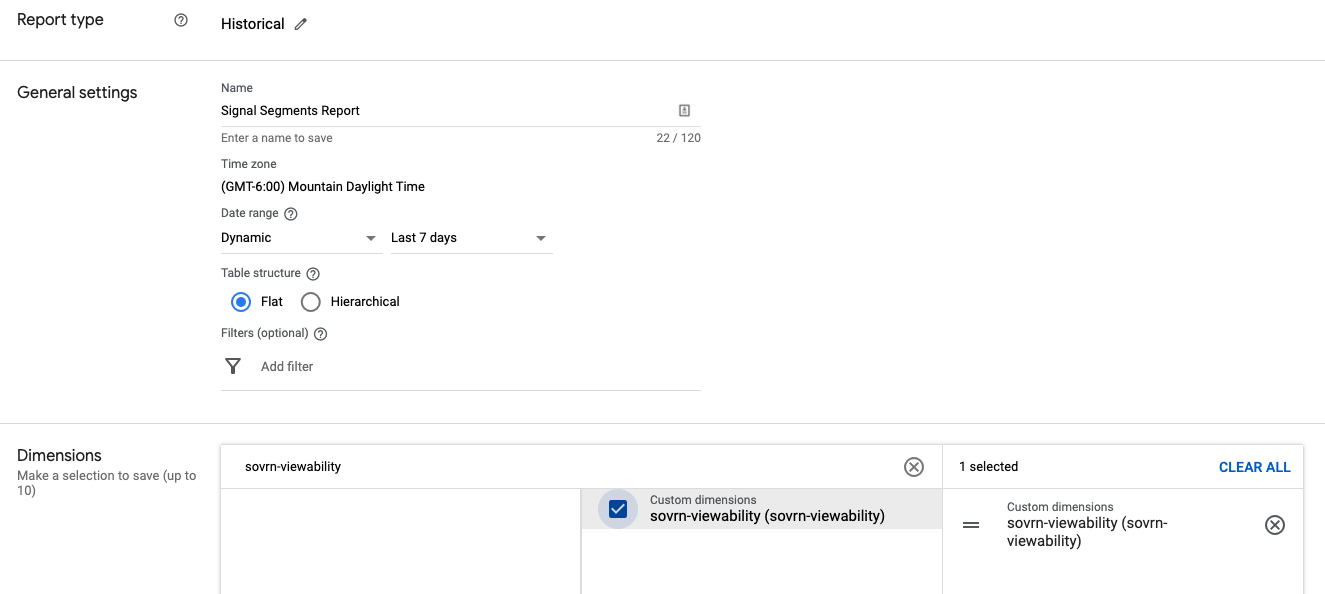
Name your report and select the desired date range, e.g. Last 7 days.
-
If when adding the key value, you selected ‘Include values in reporting & add key as custom dimension’
-
Under the ‘Dimensions’ section, search for & select ‘sovrn-viewability’ and/or ‘sovrn-engagement’.
-
-
If when adding the key value, you selected ‘Include values in reporting’
-
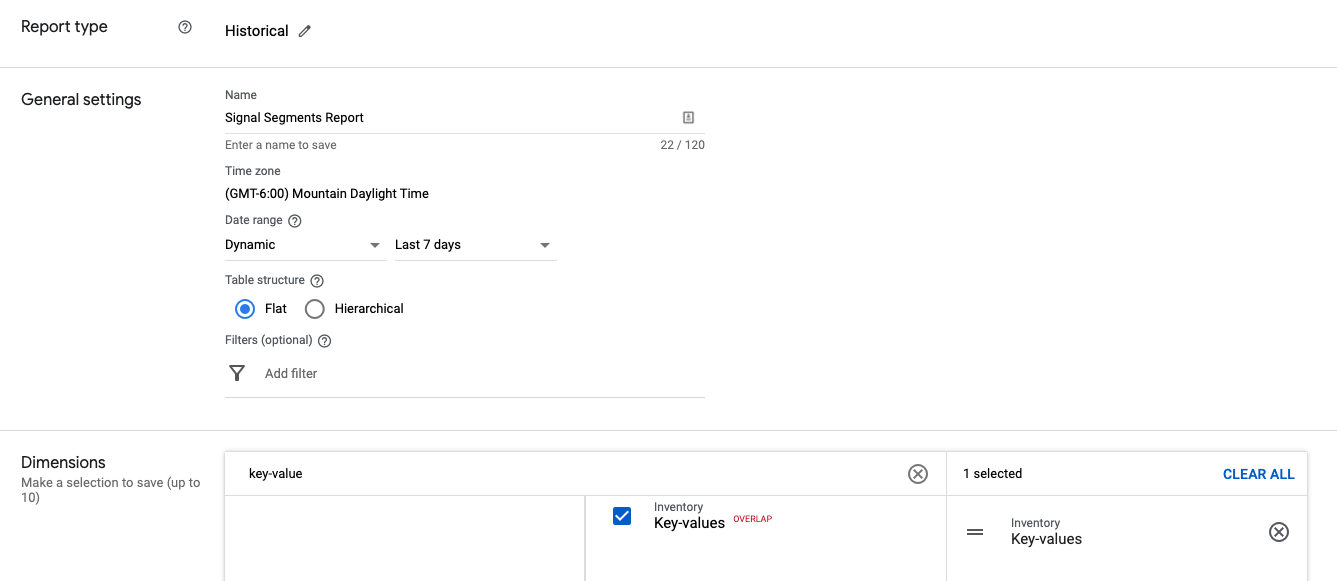
Under the ‘Dimensions’ section, search for & select ‘Key-values’.
-
-
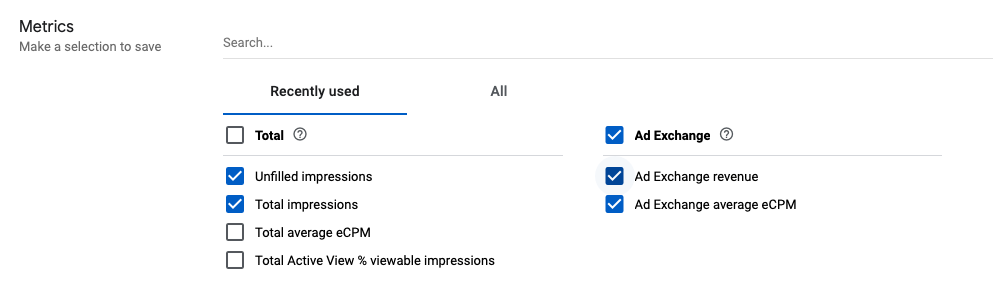
Under the ‘Metrics’ section, select:
-
Unfilled impressions
-
Total impressions
-
Ad Exchange revenue
-
Ad Exchange average eCPM
With those values selected, you can then run the report to review the avg. cpm, fill and revenue per predicted viewability score to help understand how buyers are currently reacting to viewability.
How can I optimize for direct demand?
By using Signal Segments to assign predicted viewability and engagement scores as key values to each impression, you can more accurately target your direct line items to your best performing inventory.
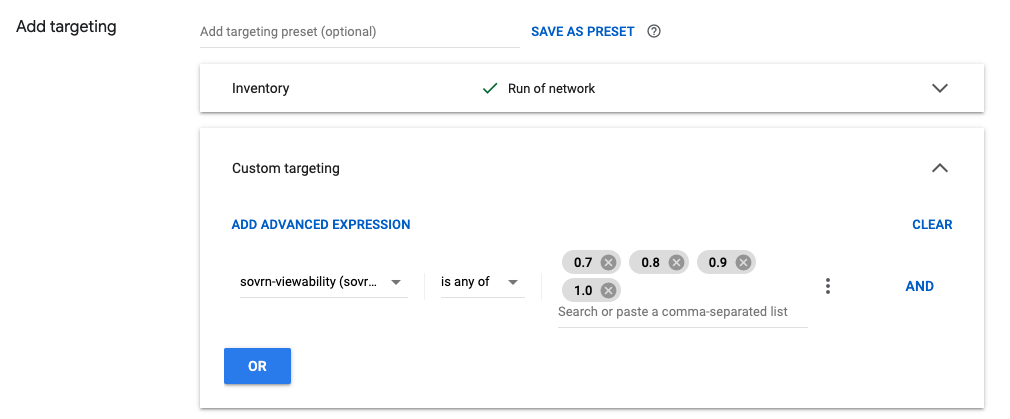
Example: A buyer you are working with directly has requested that their ads only serve on 70%+ viewable inventory:
-
Within your Google Ad Manager (GAM) account, go to Delivery > Line Items and find or create the line item for this campaign.
-
Under Add targeting > Custom targeting > search and select sovrn-viewability is any of 0.7, 0.8, 0.9, 1.0.
-
Apply any other settings to the line item & save.